Use this help guide to understand the data available.
For each driver gene, NCG provides information on:
- duplicability
- orthology
- evolutionary appearance
- protein-protein interactions
- miRNA Interactions
- functional properties
- gene expression
- protein expression
- essentiality
- drug target/biomarker
- damaging alterations in cancer samples and cell lines
Table of Contents
Searching
From the homepage the user may retrieve the information from the database in several ways:
Gene Search
The user may give a single gene identifier or a list of gene identifiers, to be chosen among five possibilities:
- Gene symbol: to query for list of genes, use * (e.g. MDM* will display 3 genes: MDM2, MDM4, MDM1);
- Entrez identifier (e.g. 5728);
- RefSeq protein identifier (e.g. NP_000305);
- Ensembl protein identifier (e.g. ENSP00000418960);
- Ensembl gene identifier (e.g. ENSG00000171862).
Screenings
The user may choose to retrieve the list of driver genes from the publications of cancer screenings or healthy tissue screenings by clicking on the corresponding numbers on the home page.
Cancer types or healthy tissues
In addition, a list of driver genes can be derived by cancer type or healthy tissue by clicking on the corresponding numbers on the home page.
Understanding Results
The results page contains 13 sections for each gene:
- Gene Description
- Driver Information
- Gene Duplication
- Evolutionary Conservation
- Protein Interactions
- miRNA Information
- Gene Function
- Gene Expression in Tissues
- Gene Expression in Cell Lines
- Protein Expression in Tissues
- Essentiality
- Germline Variation vs. Expected
- Drug Target/Biomarker
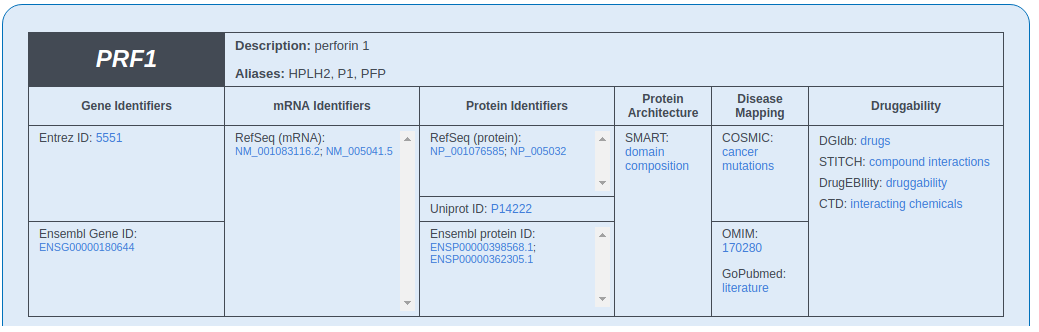
Gene Description
This section includes the general information about the queried gene: symbol, description and links to external databases, such as Entrez, COSMIC, OMIM, RefSeq, Ensembl.
Driver Information
The button Details opens a new page, containing driver support, list of cancer and non-cancer screenings in which the gene has been reported as a driver and damaging alterations in TCGA samples and cancer cell lines.

Gene Duplication
Gene Duplication is defined as in Rambaldi D et al. (2008): it is measured by aligning the corresponding protein sequences directly to the human genome, using the BLAST-like Aligment Tool (BLAT). We define as duplicates all additional genomic matches covering at least 60% of the query length. Singletons are all those genes which do not have any additional hit above 60% of the query length.
The Gene Duplication page describes all the duplicated loci related to the queried gene.

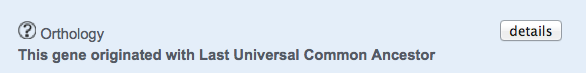
Evolutionary Conservation
The appearance of a gene is defined as the deepest taxonomic branch of the tree of life where an ortholog can be detected. In order to retrieve orthology relationships eggNOG 5.0 (Huerta-Cepas et al., 2016) is used.
Seven branches of the tree of life are defined:
- Last Universal Common Ancestor (LUCA)
- Eukaryotes
- Opisthokonts
- Metazoans
- Vertebrates
- Mammals
- Primates
The button details opens a new page, which describes all the orthology relationships of the gene of interest in detail.
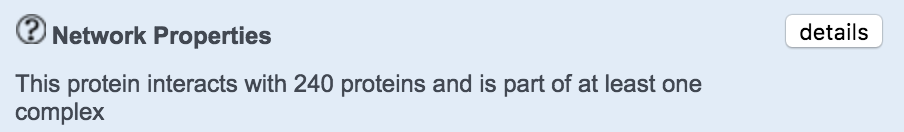
Protein Interactions
This section provides information on the protein protein interactions as well as participation in protein complexes of the protein encoded by the gene of interest. The button details opens a new page which describes all the network properties and complexes in detail.
The network properties are derived from five databases of Protein-protein interaction networks:
| Dataset | Version | Nodes | Interactions | Publications |
|---|---|---|---|---|
| BioGRID | 3.5.185 | 16,638 | 358,323 | 28,962 |
| IntAct | 4.2.14 | 14,827 | 110,899 | 7,434 |
| DIP | February 5th 2018 | 2,863 | 4,439 | 1,909 |
| HPRD | 9 | 9,407 | 36,724 | 18,692 |
| Bioplex | 3.0 | 14,277 | 163,336 | 1 |
| Total | 17,883 | 542,397 | 41,246 | |
The complex interactions are derived from three databases:
miRNA Information
The number of miRNAs regulating the gene is reported.
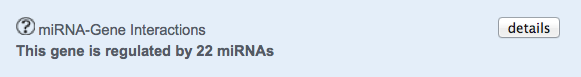
The button details opens a new page which shows the graphical representation of all the miRNAs regulating the queried gene.
Gene Function
The number of functional pathways in which the gene is involved is shown.
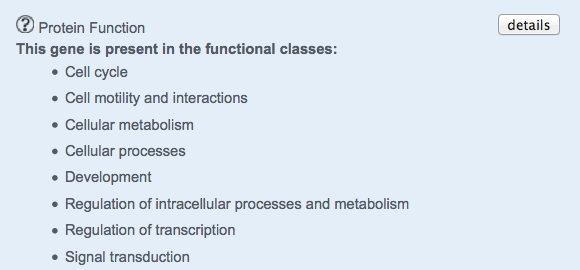
The details button opens a new page, which describes gene functions along with pathway ids and terms.
Gene Expression in Tissues
The number of Normal Tissues where the gene is expressed is shown.
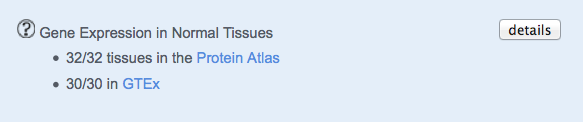
The details button opens a new page, which shows further information on the expression of the gene across normal tissues.
Gene Expression in Cell Lines
The number of Cancer Cell Lines where the gene is expressed is shown.
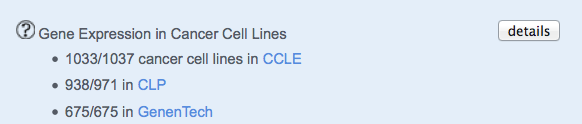
The details button opens a new page, which shows further information on the expression of the gene across cancer cell lines.
Protein Expression in Tissues
The number of Normal Tissues where the protein is expressed is shown.
The details button opens a new page, which shows further information on the expression of the protein across normal tissues.
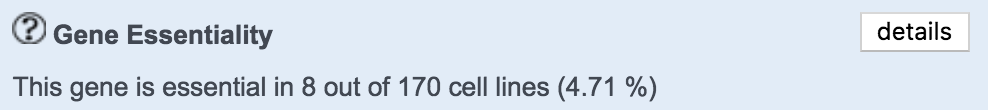
Essentiality
In this section, the number of human cell lines in which the gene has been found essential is reported. The button details opens a new page, which describes all the info related to the queried gene.
Essentiality is derived from two databases including 9 datasets:
| Dataset | CRISPR Cas9 / RNAi | Version | Genes | Cell lines |
|---|---|---|---|---|
| Achilles | CRISPR Cas9 | DepMap 20Q2 | 18,070 | 769 |
| GeCKO | CRISPR Cas9 | DepMap 19Q1 | 18,377 | 43 |
| Sanger Project SCORE | CRISPR Cas9 | DepMap August 2020 | 17,752 | 317 |
| Achilles | RNAi | DepMap 2.20.2 | 15,951 | 501 |
| DRIVE | RNAi | DepMap DEMETER2 Data v6 | 7,531 | 397 |
| PICKLES Wang | CRISPR Cas9 | September 2020 | 17,955 | 18 |
| PICKLES shRNA | RNAi | September 2020 | 13,172 | 100 |
| PICKLES Tzelepis | CRISPR Cas9 | September 2020 | 17,818 | 5 |
| PICKLES TKOV1 | CRISPR Cas9 | September 2020 | 17,050 | 9 |
| Total | 19,013 | 1,122 | ||
Germline Variation vs. Expected
In this section, the frequency of germline loss-of-function variants, damaging SNVs/indels and structural variants compared to the rest of human genes is shown.
The details button opens a new page, which gives a definition of a LOEUF score, its value for the queried gene and median across all human genes, number of damaging SNVs/indels and structural variants normalized by gene length split across alteration types with a median across all human genes.
Drug Target/Biomarker
This section provides information on the drugs targeting the gene and on the involvement of the gene as a biomarker of response or resistance in cancer cell lines and clinical trials.
The details button opens a new page that lists all the drugs and the associations between drugs, gene and response in the cell lines and clinical settings.
Driver Information
This page provides support on the cancer driver type (canonical/candidate), the screenings in which the gene has been reported as a driver and damaging alterations in both TCGA samples and cancer cell lines.
Details
The Canonical/candidate support tab provides information on the cancer driver type of the queried gene (canonical or candidate cancer driver). For candidates, it also reports the predicted driver mode of action (putative oncogene, tumour suppressor or unclassified mode of action) based on the prevalence of gain-of-function or loss-of-function alterations in TCGA samples.
The Cancer/healthy drivers screens tab provides information on the screenings where the queried gene was identified as a driver (number of publications, methods, cancer types/healthy tissues, primary/organ sites). Clicking on the screening leads to a detailed table:
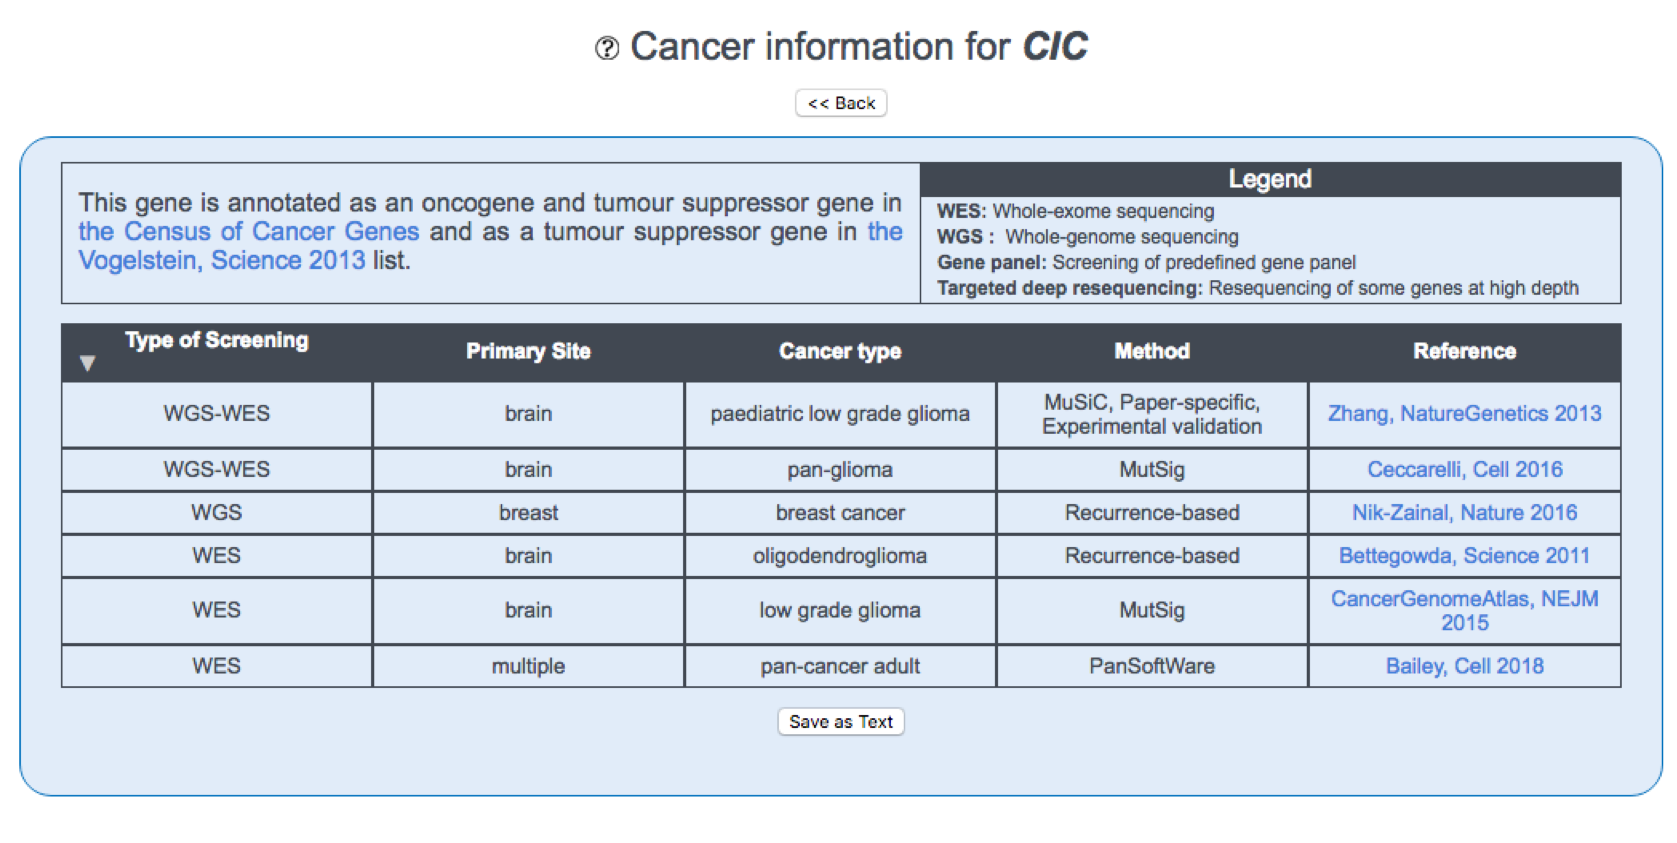
The first column, Type of Screening, describes the type of screening in which the gene is reported. This can be one of the following:
- Whole-exome sequencing (WES) of cancer samples,
- Whole-genome sequencing (WGS) of cancer samples,
- Screenings of predefined gene panels,
- Targeted deep resequencing,
- Combinations of the above.
The second, third and fourth columns describe the Organ system, Primary site/Organ site and Cancer type/Healthy tissue where the gene is reported as a driver.
The fifth column, Method, describes the method used in the original screening to determine that the gene is a driver. This can be one of the following:
- DrGap (Hua et al, 2013);
- Greenman-based (Greenman et al, 2006);
- GRIN (Pounds et al, 2013);
- HOTNET2 (Leiserson et al, 2015);
- IntOGen (Gonzalez-Perez et al, 2013);
- InVEx (Hodis et al, 2012);
- Literature-based: a gene is considered a driver in a screening if it is include_onced in databases of known cancer genes (Cancer Gene Census or Vogelstein) or was previously identified as a driver in previous screenings for the same type of cancer or other cancers;
- MuSiC (Dees et al, 2012);
- MutComFocal (Trifonov et al, 2013);
- MutSig (Lawrence et al, 2013);
- OncodriveFM (Gonzalez-Perez et al, 2013);
- PanSoftWare (Bailey et al, 2018);
- Paper-specific: a gene is considered a driver based on pre-defined criteria by the authors;
- PathScan (Wendl et al, 2011);
- Recurrence-based method (the gene is mutated more frequently than other genes, although no formal statistical method is applied);
- TumOnc (Bonilla et al, 2016);
- Wood-based (Wood et al, 2007);
- Youn-based (Youn et al, 2011);
- Combination of several methods.
The sixth column, Driver type, provides whether a driver is found within a coding or a non-coding sequence.
The last column, Screening, provides a link to the screening where the gene was reported as a driver.
The Damaging alterations tab contains links to damaging alterations in TCGA samples and cancer cell lines. Clicking on the Damaging alterations links leads to a detailed table:
The first, second and third columns list the Organ system, Primary site and Cancer type where the gene is found damaged, respectively.
The fourth column, TCGA samples (n)/Cell lines (n), reports the number of samples or cell lines where the gene is found damaged.
The final column, Damaging alterations (n), provides the number and type of damaging alterations that were found in cancer samples or cell lines for the queried gene.
Gene Duplication
Details
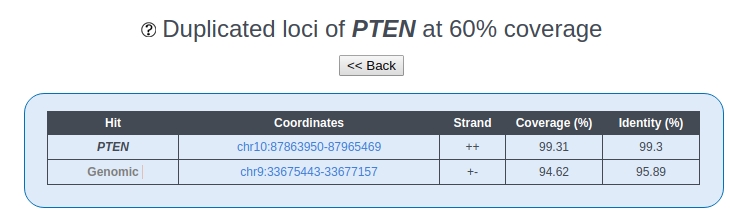
Gene Duplication is defined as in Rambaldi D et al. (2008): it is measured by aligning the corresponding protein sequences (RefSeq v99; O'Leary et al., 2016) directly to the human genome (hg38), using the BLAST-like Aligment Tool (BLAT). We define as duplicates all additional genomic matches covering at least 60% of the query length. Singletons are all those genes, which do not have any additional hit above 60% of the query length.
Three types of Hit are defined, depending on the genomic location of the duplicated locus:
- Best Hit, which corresponds to the original gene locus;
- Other Gene Hits, which include other gene loci where the gene of interest is duplicated;
- Genomic, which include loci where no known gene map to (no genes are defined by the UCSC Genome Browser, but mRNAs or ESTs may be present).
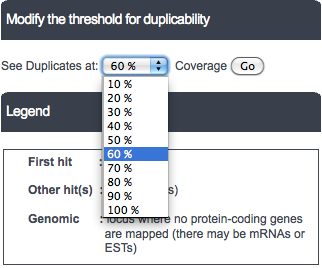
The default cutoff to display genomic hits is 60% of the original length, but the user is allowed to choose different cutoffs from the dropdown box above the table. The range of choice varies from 10% of the query length to 100%.
Evolutionary Conservation
The orthology relationships are derived from eggNOG 5.0 (Huerta-Cepas et al., 2018).
Tree of life
The Tree of Life provides a visualization of the origin and the orthologs of the gene of interest. The origin of the gene is represented by red color.
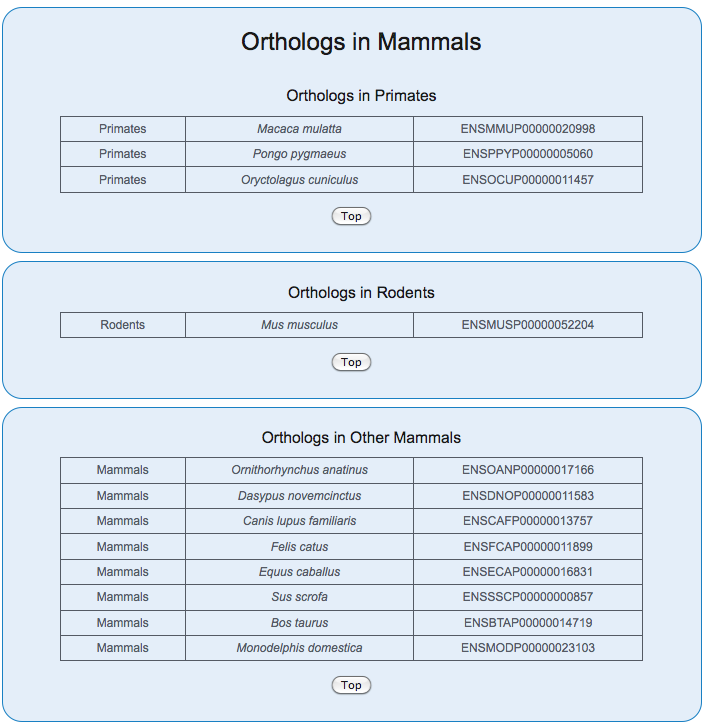
Evolutionary Conservation Table
The tables describe all the species and the corresponding orthologs. In case the node has further branching with orthologus genes, the species from the lower nodes are also shown.
Protein-Protein Interactions
Three parameters describe the position of a protein in the protein protein interaction network:
Network visualization
On the top, the first-level network for the protein encoded by the gene of interest (which is in the centre of the image) is displayed. In the bottom, the interaction partners of the protein of interest can be filtered by different properties (for more help on those properties, please check the respective section of the help page). Proteins are colour coded according to their driver status. The network is constructed and displayed using the R shiny and igraph packages.
Network table
The table lists the protein-protein interaction network degree, betweenness and clustering coefficient for interactors of the protein of interest. In addition, the Pubmed IDs of the original publication(s) supporting the interaction are listed.
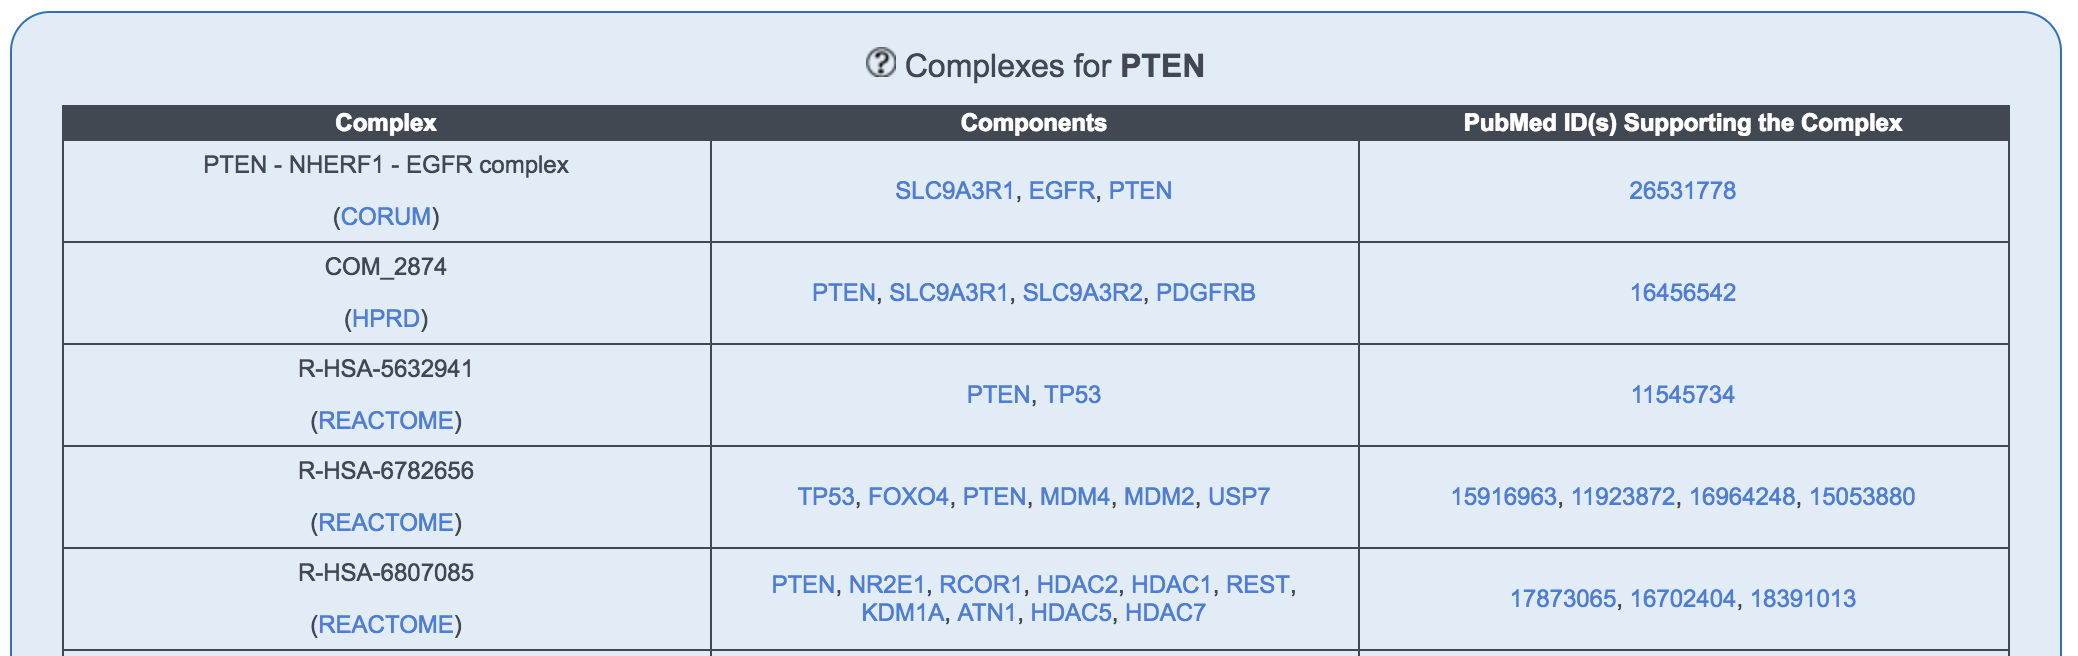
Complex table
The table lists the complexes which the protein of interest is a part of.
- Complex: This is the name provided for the complex by the original database indicated (CORUM, HPRD or Reactome). Note that the same complex can be listed more than once since it is named differently by different databases.
- Components: Human proteins involved in this complex. Note that there might be other components of the complex which are not proteins. To find these, please refer to the link in the Complex column. In case 2 different complexes have the same components, they may be composed of the same proteins, but non-protein components may differ.
- PubMed ID(s) supporting the complex: Publications supporting this complex.
miRNA Interactions
The network of miRNA-target interaction is composed of cancer genes and the miRNAs targeting them. The network displays only interactions that are supported by experimental validations. The miRNA data are derived from miRecords v.4.0, Xiao F et al., 2009 and miRTarBase v.8.0 (Huang et al., 2020).
Network visualization
The interaction network of the gene of interest with miRNAs is shown. The gene is in the middle of the network and colour coded according to its driver status.
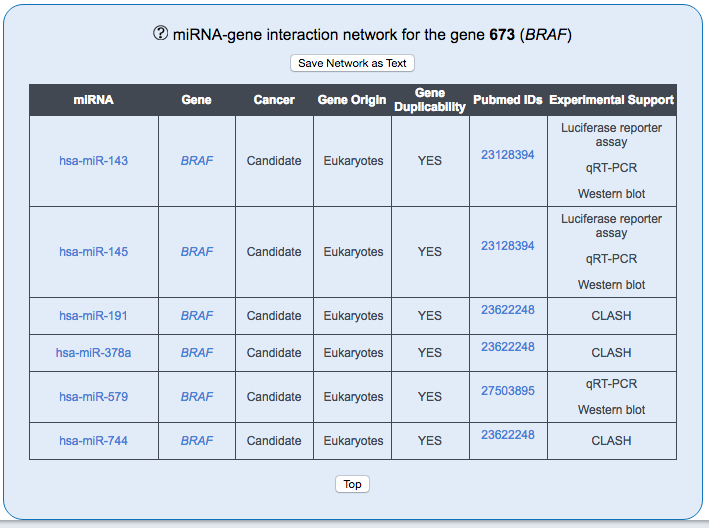
Network Table
The Table includes all miRNAs and target genes visualized in the network. Each row provides information on the the target gene: involvement in cancer, evolutionary origin, and duplicability. The Pubmed IDs column contains the links to the publication supporting the interaction, while the last column describes the methods employed to experimentally validate the interaction.
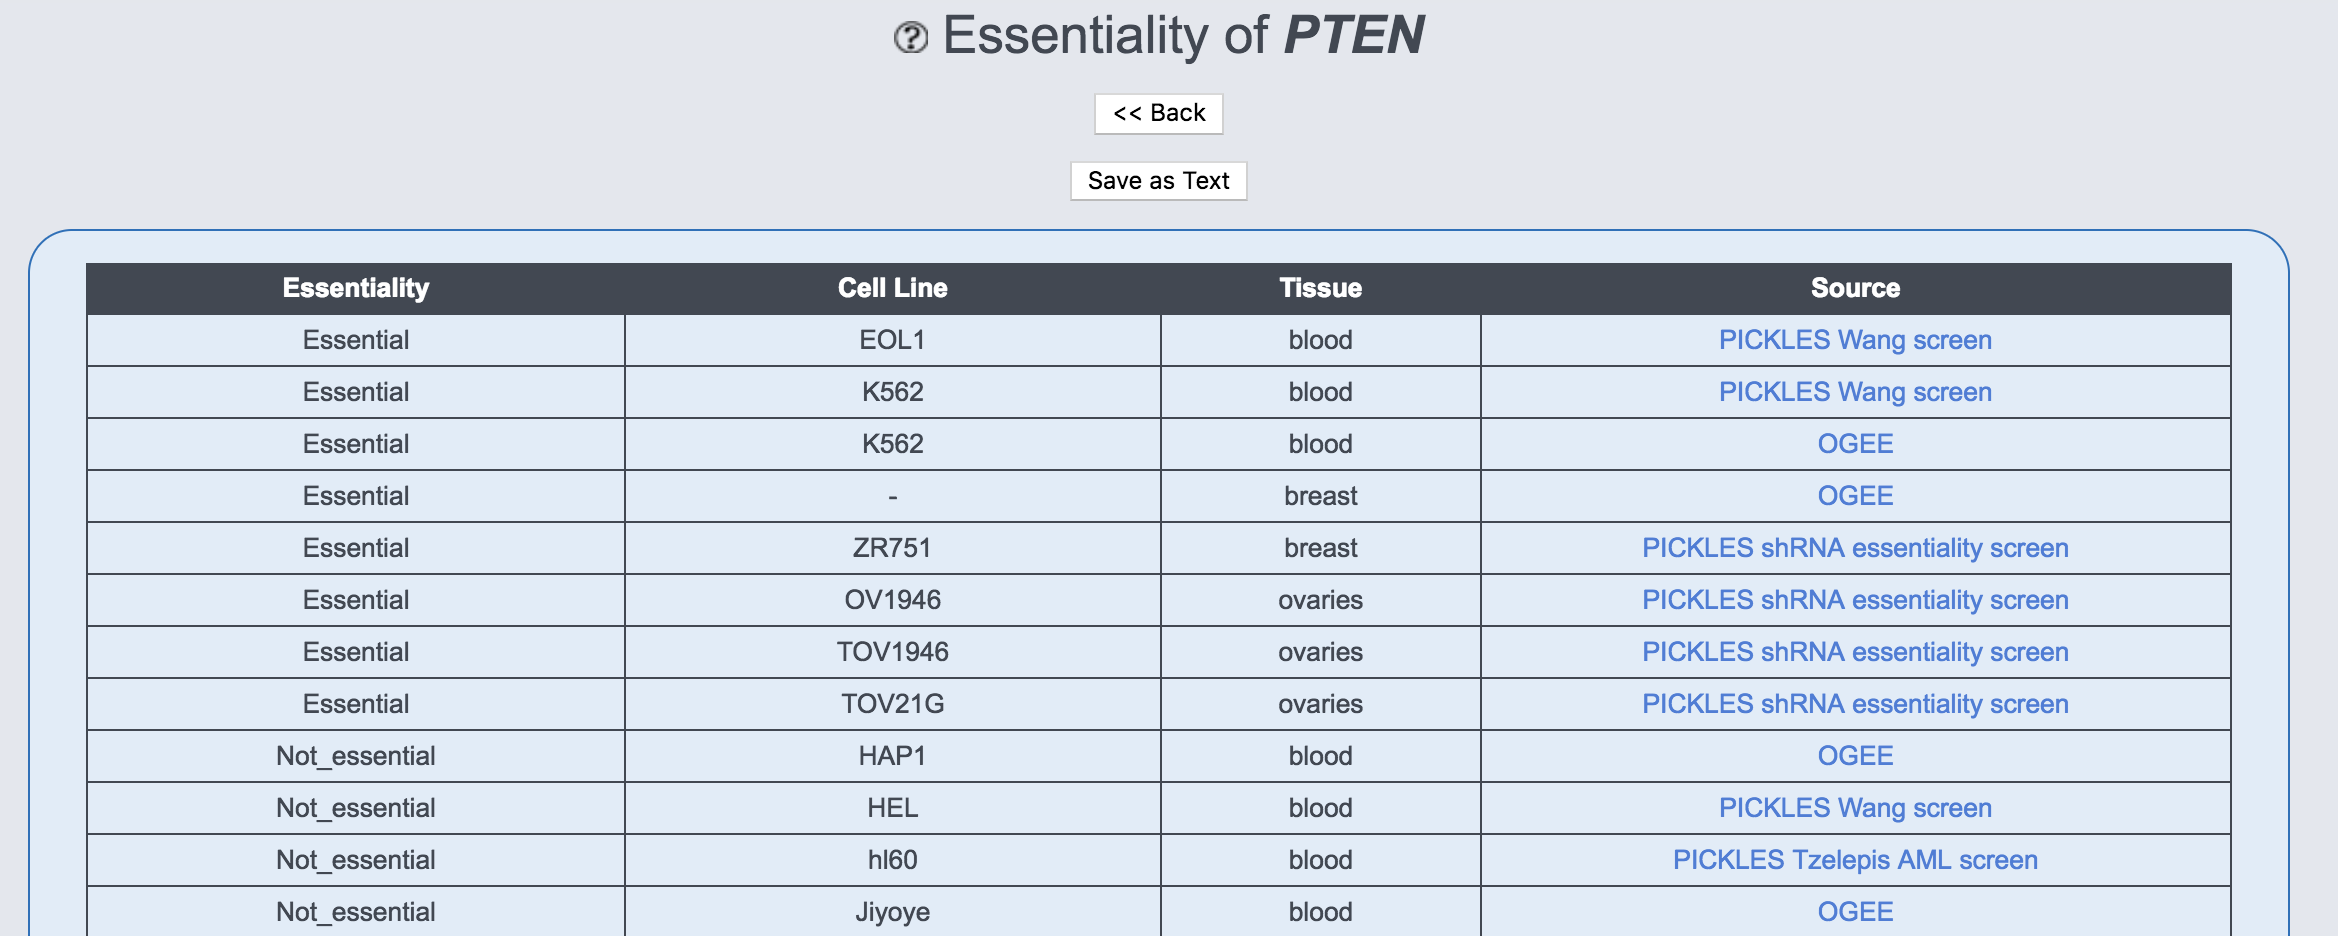
Essentiality
This table provides information on the essentiality of the gene for cell survival. It lists whether the gene has been found essential or not in the respective human cell line and tissue in nine screens obtained from the DepMap and PICKLES databases.
Details
The user may give a single gene identifier or a list of gene identifiers, to be chosen among four possibilities:
- Essentiality: The score can either be Essential or Not_essential for each cell line or tissue in each screen. The cell lines in which the gene is essential are listed at the top. In line with the original publications, genes with a CERES or DEMETER score <-1 or a Bayes score >5 were considered as essential.
- Cell line: This column contains the cell line in which the gene has been tested for essentiality. When a screen used several cell lines of the same tissue to derive the essentiality score, this column contains a dash.
- Tissue: This column contains the tissue in which the gene has been tested for essentiality.
- Source: The database which was used to obtain the information.
Gene Function
This page displays functional information from KEGG v94.1 and Reactome v72 for the gene of interest.
Details
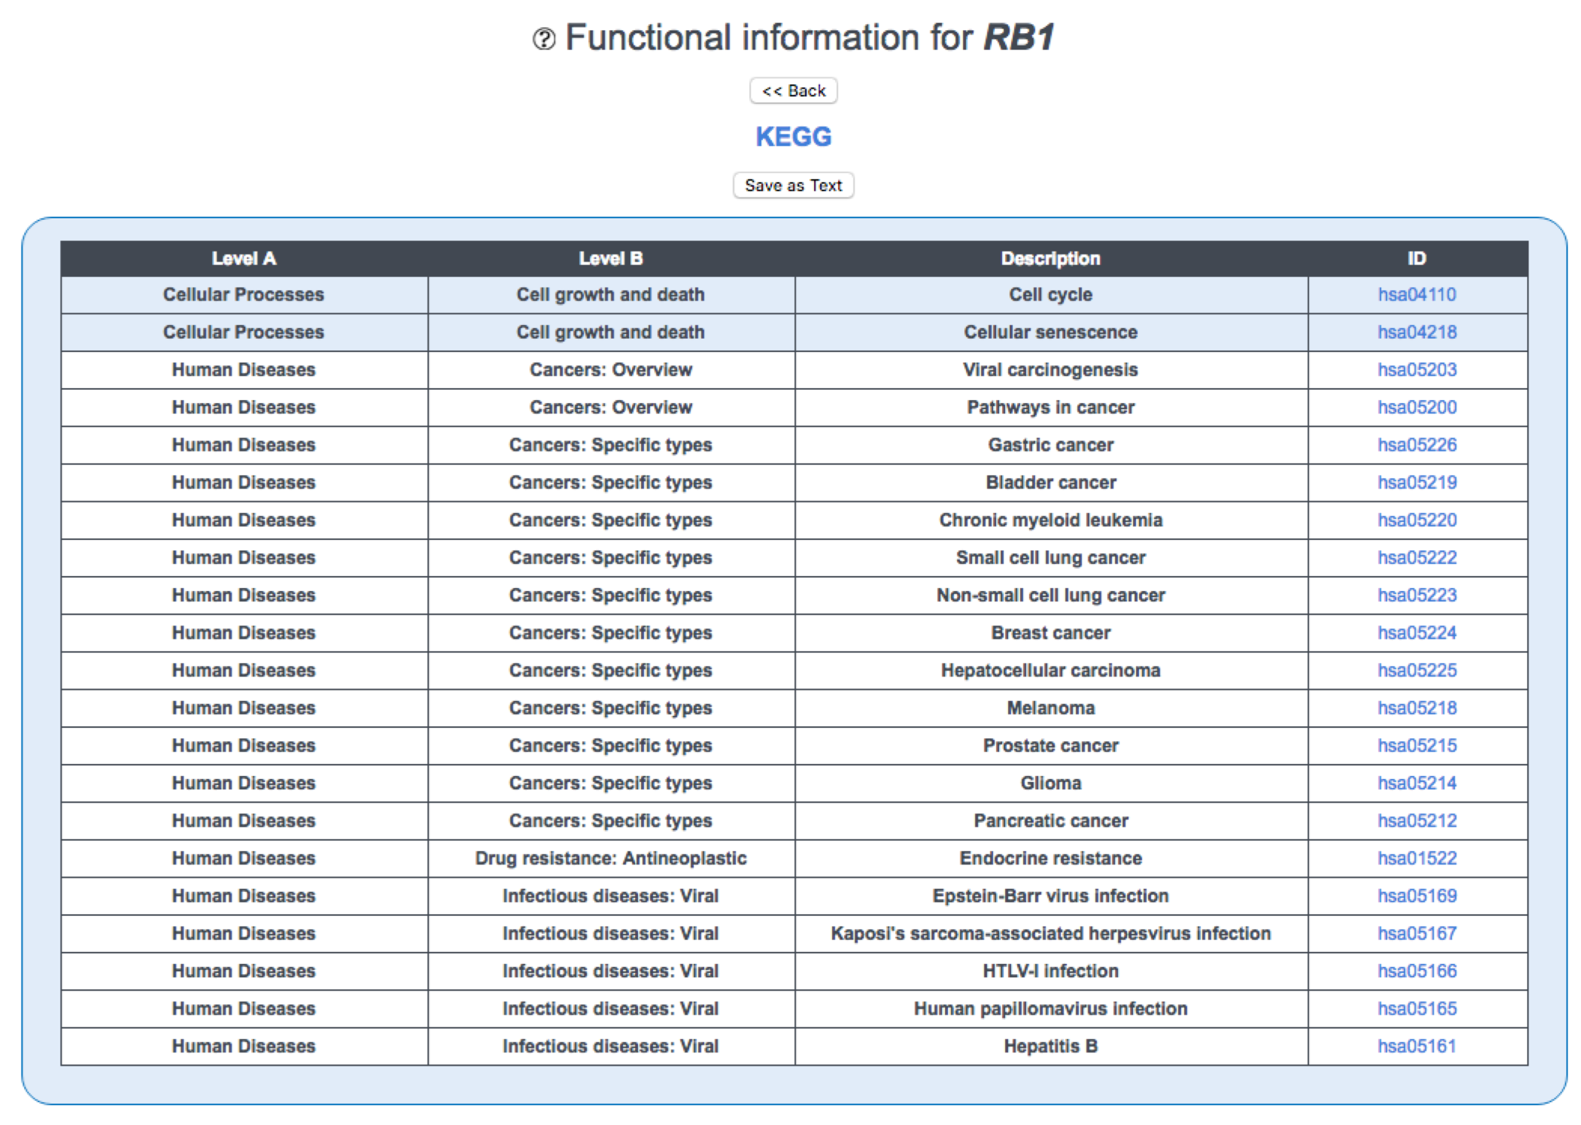
This page displays functional information from KEGG v94.1 and Reactome v72 for the gene of interest.
KEGG is a three-level hierarchical database of biological pathways. This table lists the lowest-level pathways to which the gene belongs ('Description'); links to the corresponding pathway maps ('ID'); and higher-level functional information ('Level 1', 'Level 2').
Reactome is a multi-level hierarchical database of biological pathways. This table lists the pathways at level two or greater to which the gene belongs ('Description'); the levels of these pathways ('Level'); links to the relevant section of the Pathway Browser ('ID'); and the corresponding level one pathways ('Level 1').
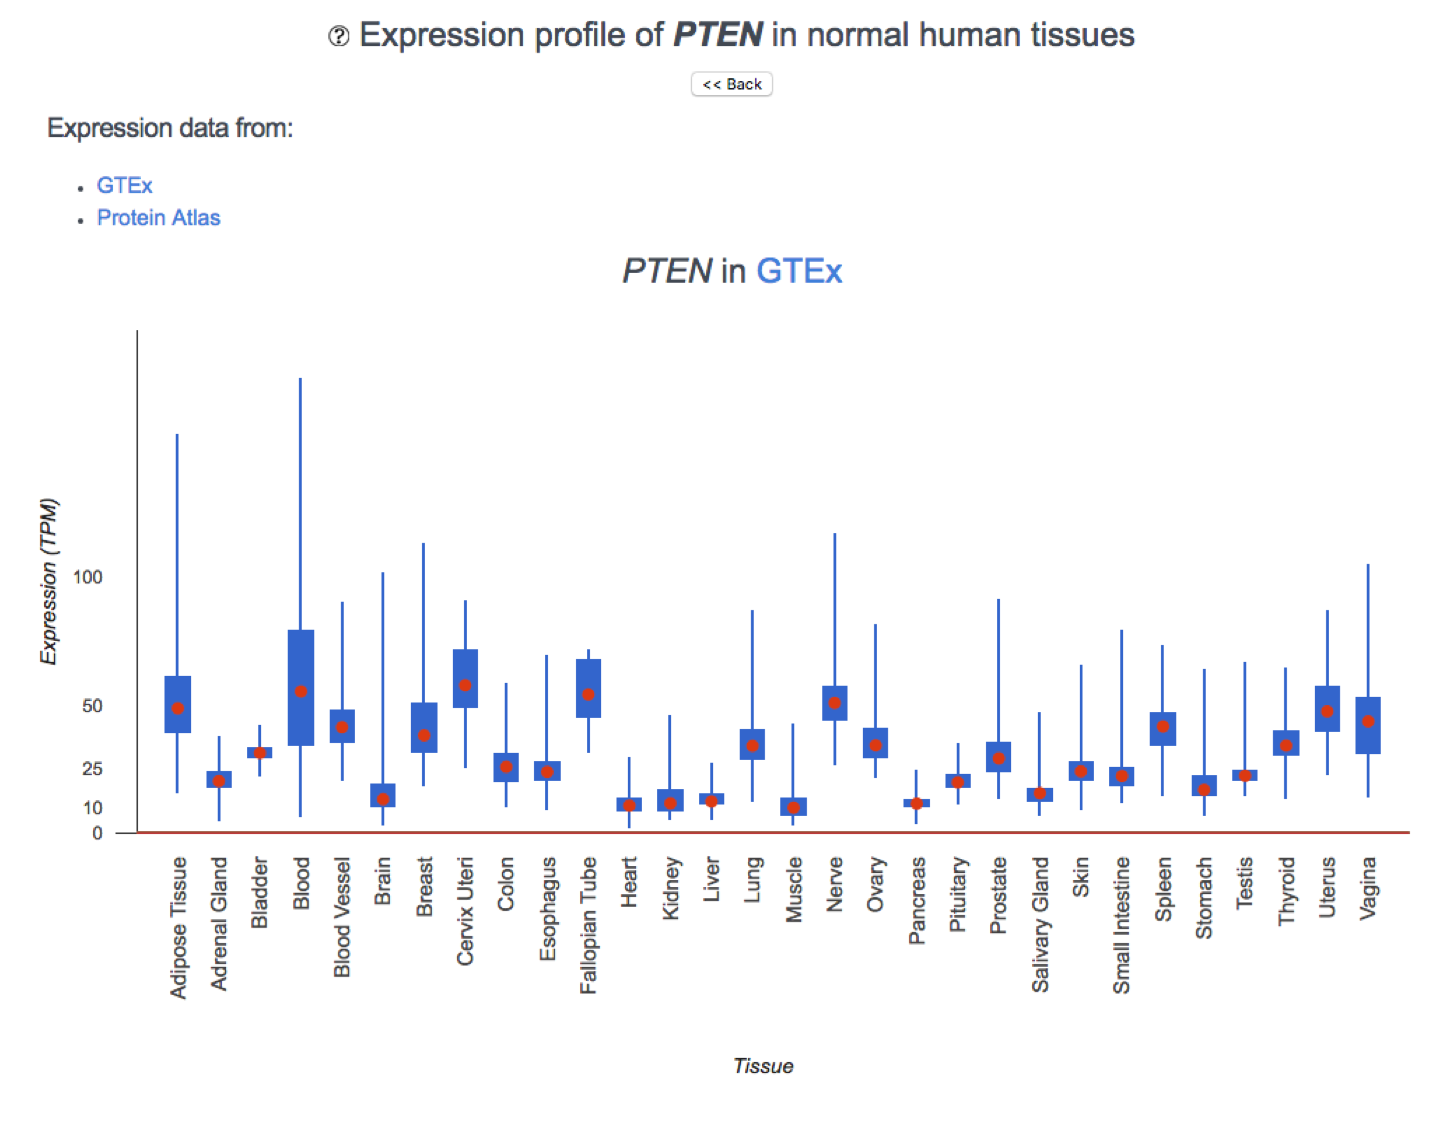
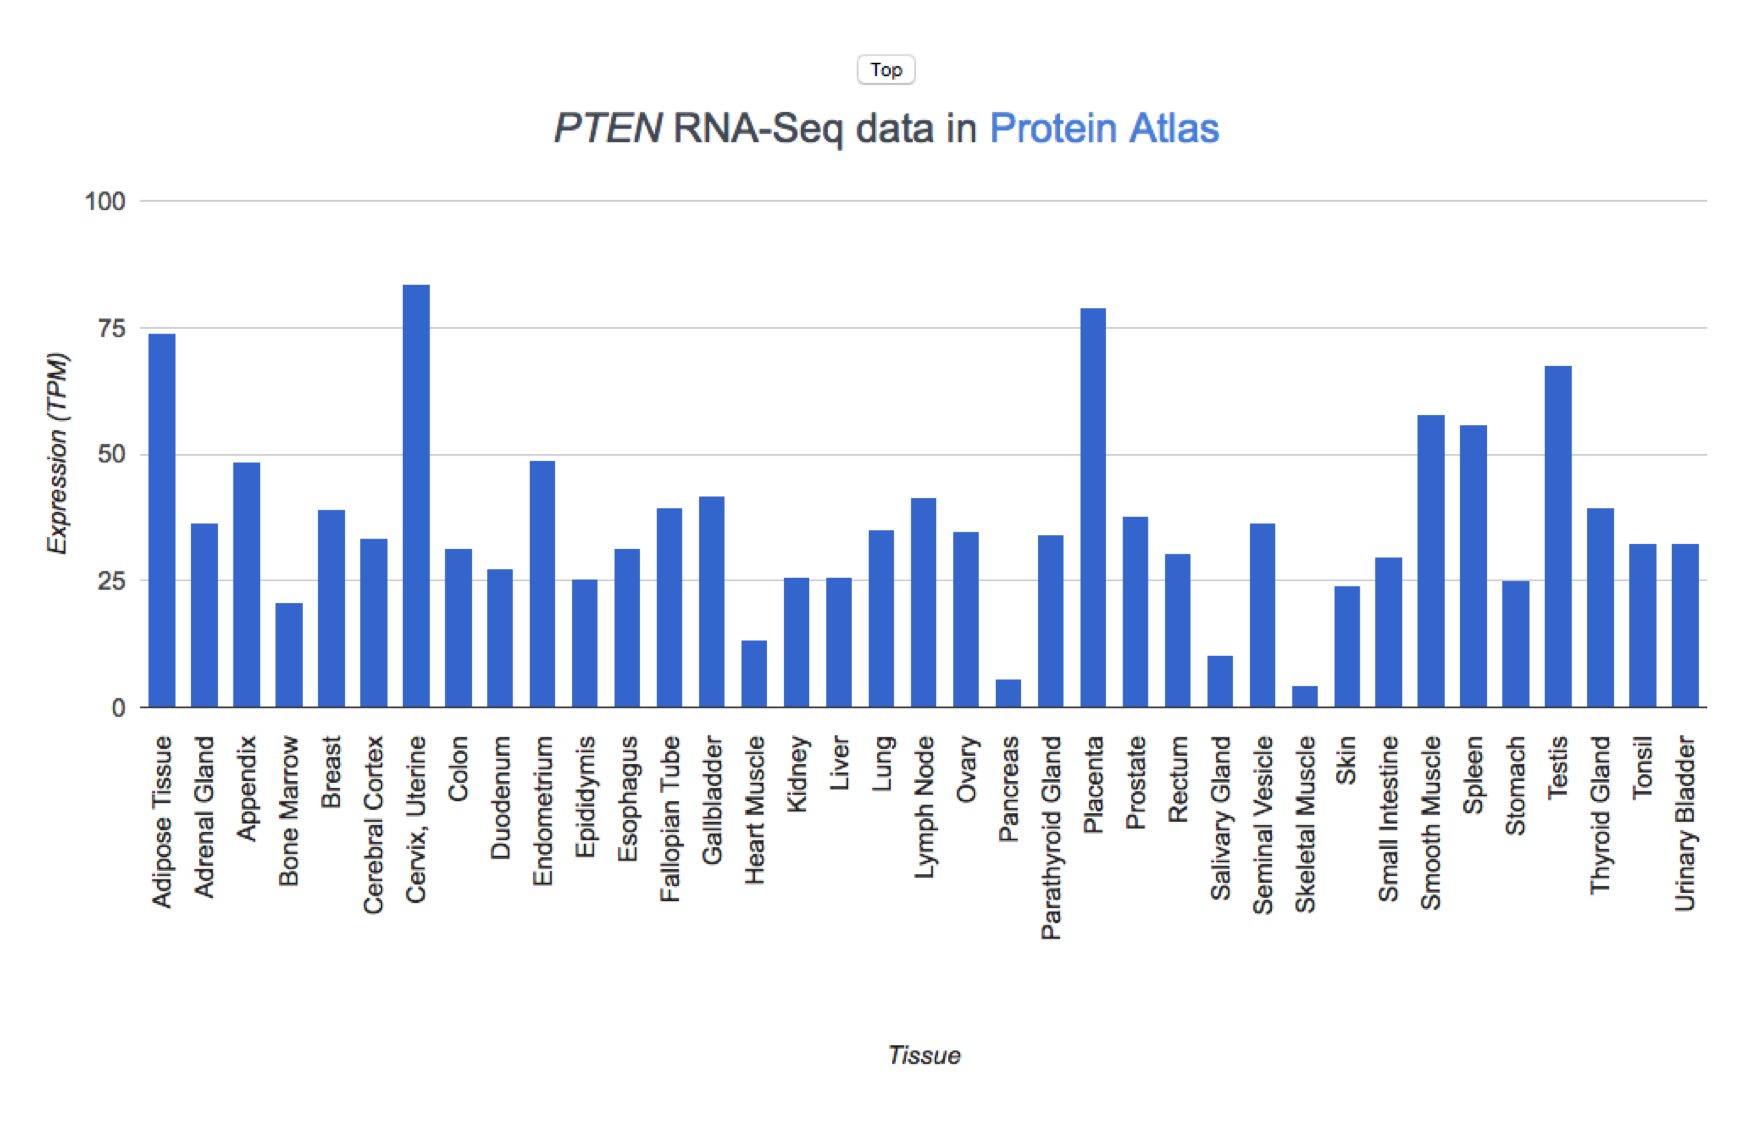
Gene Expression in Tissues
Expression levels are derived from two sources:
Details
- GTEx v8 provides RNA-seq expression data from 17,382 samples across 30 tissues. We report the TPM values. Genes are considered to be expressed in a tissue if they have a TPM value of at least 1.
- The Human Protein Atlas v19.3 provides RNA-seq data (HPA dataset) as average (mean) TPM values across samples in each of 43 tissue types. We use Protein Atlas' recommended threshold of 1 TPM to determine categorical expression.
The results are plotted separately for each experiment.
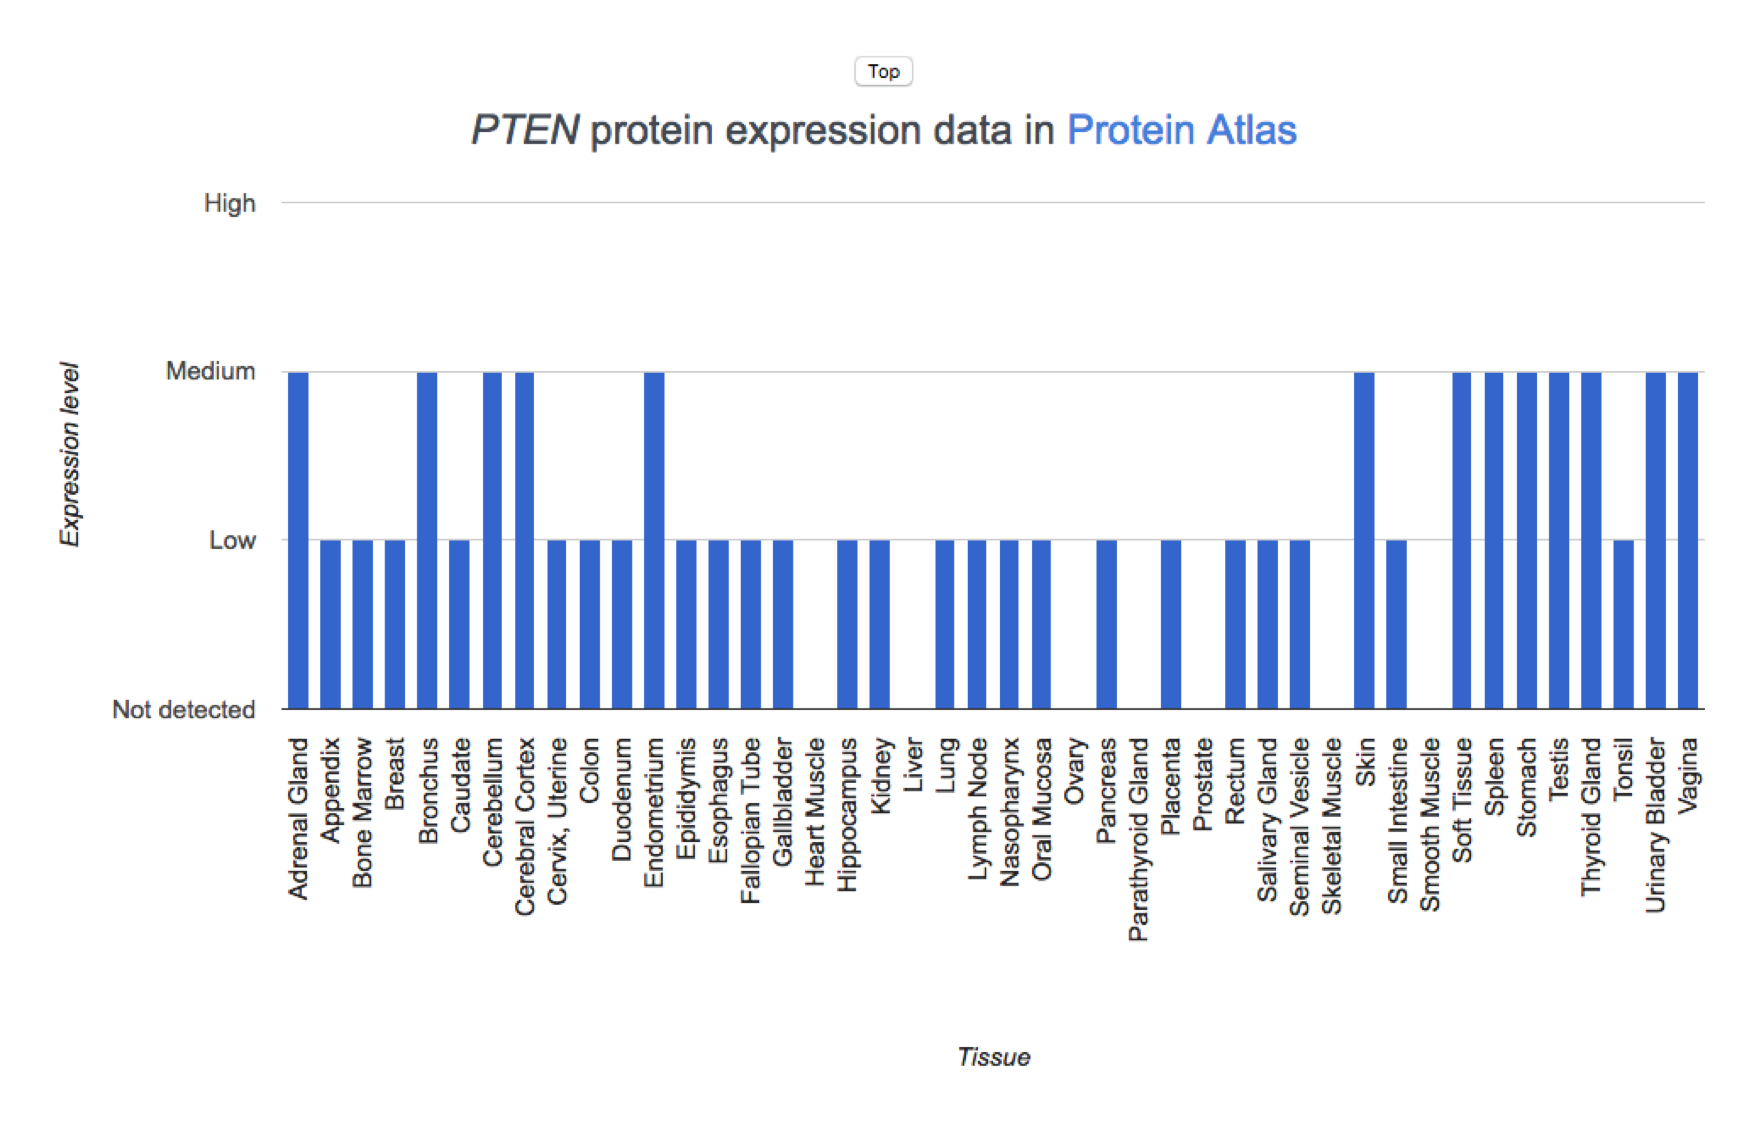
Protein Expression in Tissues
The Human Protein Atlas version v19.3 provides protein expression data from immunohistochemistry assays in normal tissue samples. Expression is reported as Not detected, Low, Medium, or High in 45 tissue types
Details
The results are shown in a column chart.
Gene Expression in Cell Lines
Expression levels in cancer cell lines are derived from three sources:
Details
- The Cancer Cell Line Encyclopedia (CCLE) provides RNA-Seq data from 1,019 cancer cell lines. We report the RPKM values from the May 2020 version.
- The COSMIC Cell Lines Project (CLP) provides Affymetrix U219 expression data from 970 cancer cell lines. We report the normalized z-scores and the classification into over, normally, and under-expressed genes from COSMIC v91.
- The Genentech Cell Lines dataset (Klijn, 2015) provides RNA-seq expression data from 675 cancer cell lines. We report the RPKM values downloaded from ArrayExpress.
The results are shown separately for each experiment.

Germline Variation vs. Expected
Germline variation data falls into three categories:
Details
- LOEUF score (Loss-of-function Observed/Expected Upper bound Fraction) is a gene-level metric of tolerance to loss-of-function variants. This metric only describes tolerance to small LoF variants and doesn’t consider copy number alterations. This metric was taken from gnomAD (Karczewski et al., 2020).
- Damaging small variants were derived from 125748 WES samples from gnomAD (v2.1.1) and 2504 WGS samples from 1000 Genomes Phase 3 v5a. For a definition of a damaging variant check Methods of the latest NCG publication. The total number of variants was calculated for each gene and normalised by gene length.
- Structural variants were derived from 15708 WGS samples gnomAD (v2.1.1). The total number of variants was calculated for each gene and normalised by gene length.
Drug Target/Biomarker
We report the drugs that target the gene and the associations between drugs, gene and response in cell lines and clinical settings.
Details
- DrugBank v5.1.8 contains information on antineoplastic and immunomodulating drugs targeting human genes. The drug commercial name and its DrugBank ID are reported along with its mode of action.
- The biomarkers of response to drugs in cell lines are downloaded from Genomics of Drug Sensitivity in Cancer (GDSC) v8.2. The table shows the drug commercial name and its GDSC ID, the type of gene alteration causing the response, the type of response and the cancer type in which the biomarker was observed.
- The Variant Interpretation for Cancer Consortium Meta-Knowledgebase v1 contains information relative to the association between cancer drugs and molecular features that cause response in clinical settings. The drug commercial name, the number of cancer alterations associated with the response, the type of response and the link to the knowledgebase are reported.
TIME drivers
We report cancer drivers interacting with the tumour immune microenvironment with literature, experimental or in silico support.
Details
- Literature supported TIME drivers were derived from Mantovani, Nature 2008 & Wellenstein, Immunity 2018 .
- Experimentally supported TIME drivers were derived from Martin, Science 2021, Lawson, Nature 2020 & Dhainaut, Cell 2022.
- In silico supported TIME drivers were derived as described in Misetic, Genome Medicine 2023 and were classified into TIME drivers predictive of pro-tumour TIME (high cancer-promoting inflammation, low abundance of cytotoxic cells, low T-helper activity or low anti-tumour inflammation) or anti-tumour TIME (low cancer-promoting inflammation, high abundance of cytotoxic cells, high T-helper activity or high anti-tumour inflammation) for each cancer type. For any further details please check Misetic, Genome Medicine 2023
Download
This section allows users to download information from the NCG database. There are four files available to download:
Details
The first downloadable file is a list of cancer drivers, their annotation and supporting literature. There is one row per gene-screen pair. The columns contain:
- Gene Entrez ID
- Gene symbol
- PubMed ID
- Screen type (e.g. WES, WGS)
- organ system
- Primary site
- Cancer type
- Method by which the gene was identified
- Coding status
- CGC driver annotation
- Vogelstein driver annotation
- Saito driver annotation
- Oncogene annotation
- Tumour suppressor gene annotation
The second downloadable file is a list of healthy drivers, their annotation and supporting literature. There is one row per gene-screen pair. The columns contain:
- Gene Entrez ID
- Gene symbol
- PubMed ID
- Screen type (e.g. WES, WGS)
- organ system
- Primary site
- Healthy tissue
- Method by which the gene was identified
The third downloadable file is a list of cancer drivers and their systems-level properties. There is one row per gene. The columns contain:
- Gene Entrez ID
- Gene symbol
- Number of duplicated loci at 60% coverage
- Evolutionary conservation (taxonomic group)
- Percentage of cell lines in which the gene was found to be essential
- Number of tissues in which the gene is expressed according to RNA-seq data (out of 43)
- Degree of the gene in the protein-protein interaction network (PPIN)
- Betweenness in the PPIN
- Clustering coefficient in the PPIN
- Number of complexes in which the protein is a component
- Number of targeting miRNAs
- Number of expressed tissues on mRNA level in GTEx
- Number of expressed tissues on mRNA level in Protein Atlas
- Number of expressed tissues on protein level in Protein Atlas
- Number of expressed cell lines in CLP
- Number of expressed cell lines in GNE
- Number of expressed cell lines in CCLE
- Number of germline damaging SNVs and indels/gene length
- Number of germline SVs/gene length
- LOEUF score
The fourth downloadable file is is a list of healthy drivers and their systems-level properties.There is one row per gene. The columns contain:
- Gene Entrez ID
- Gene symbol
- Number of duplicated loci at 60% coverage
- Evolutionary conservation (taxonomic group)
- Percentage of cell lines in which the gene was found to be essential
- Number of tissues in which the gene is expressed according to RNA-seq data (out of 43)
- Degree of the gene in the protein-protein interaction network (PPIN)
- Betweenness in the PPIN
- Clustering coefficient in the PPIN
- Number of complexes in which the protein is a component
- Number of targeting miRNAs
- Number of expressed tissues on mRNA level in GTEx
- Number of expressed tissues on mRNA level in Protein Atlas
- Number of expressed tissues on protein level in Protein Atlas
- Number of expressed cell lines in CLP
- Number of expressed cell lines in GNE
- Number of expressed cell lines in CCLE
- Number of germline damaging SNVs and indels/gene length
- Number of germline SVs/gene length
- LOEUF score